ATR Indicator Guide: How to Use ATR in Forex Trading
As a trader, you are always on the lookout for the best technical analysis tool to point you to the most profitable trade setup. However, the indicator that one picks is often contingent on the trading style. Some traders will settle for volatility trading, while others are more adept at trading the trend. The true average range (ATR) indicator is often the likely tool deployed for technical analysis for traders who lean towards tracking and exploiting market volatility.
What is the ATR indicator?
As an indicator, the Average True Range (ATR) is merely a tool with which forex traders quantify a currency pair’s volatility. The true range comprises of differences in periods of highs and periods of lows. When a series of these true ranges are decomposed and averaged out, the capture volatility in a market might experience limit/gap moves. Common techniques of measuring volatility often miss such moves, and this is what makes ATR a great companion for forex traders.
Like the Average Directional Movement Index (ADX), Relative Strength Index (RSI), and Parabolic SAR, ATR is a product of the genius of J. Welles Wilder. Wilder documented his prolific indicator development prowess in a book titled New Concepts in Technical Trading Systems, which came out in 1978. A unique aspect of ATR is that it can reliably capture a currency pair’s volatility even when other formulas miss it.
How does ATR work?
Although ATR is among the easiest indicators to read, the principle behind it might seem challenging to some traders. But perhaps these are traders who have not taken the time and effort to learn how the indicator works. Before we delve into the indicator’s working details, let us first go over how to calculate the ATR.
According to Wilder, calculating the ATR starts from finding out the true range. To this end, Wilder specified three methods.
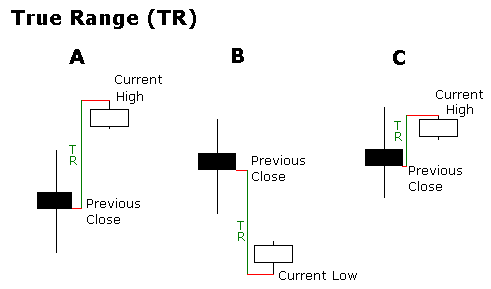
First Method: subtract the current low from the current high.
Second Method: subtract the previous close from the current high. This value is always absolute.
Third Method: subtract the previous close from the current low. Also, this value is absolute.
Of the three methods, the one that gives the greatest value is the true range. The aim of Method two and three is to cater to gaps/limits in the market. In the figure below, we show a graphical illustration of how ATR is calculated. This figure shows how to calculate the indicator when there is a gap in the market of the particular financial instrument:

Recall that the ATR averages out the true ranges of a currency pair. However, traders use a 14-period moving average to calculate ATR. In other words, the ATR is a 14-period moving average of all the true ranges in the market.
Many steps go into identifying the current ATR. Because of the 14-period moving average observance, Wilder counselled that one should calculate the current ATR by first multiplying the previous ATR by 13. Then, add the current true range to the product. Lastly, divide the figure you get by 14. As a formula, this process can be shown thus:
The crux of basing the moving average calculation on 14 days is to make the indicator sensitive enough to be utilized across all trading charts, i.e., from intraday and daily to monthly.
Usage of ATR
Wilder made it clear that ATR does not signal the direction of price action. Instead, the indicator purely measures volatility within the market of a target currency pair. When superimposed on a price chart, the indicator tells you when market volatility is high and when it declines.
In forex, traders have perfected ATR’s use as a tool to exit a position and determine the size of an order when entering the market. ATR’s most common place usage is to help traders place stop-loss orders in the most appropriate instances. Specifically, the indicator indicates the market condition in a way that allows you to avoid too tight stops in periods of high volatility, as well as too wide stops in periods of low market volatility.
Example of usage of ATR in forex
The ATR simplifies the determination of a proper stop-loss price level such that it is not too wide nor too tight. Before we see how this can be done, we would like you to note one key principle to using the ATR. The principle is that if you go long and the price favors your position, then keep the stop loss at a value below the currency pair price that is two times the value of the ATR. Let us see this in practice.
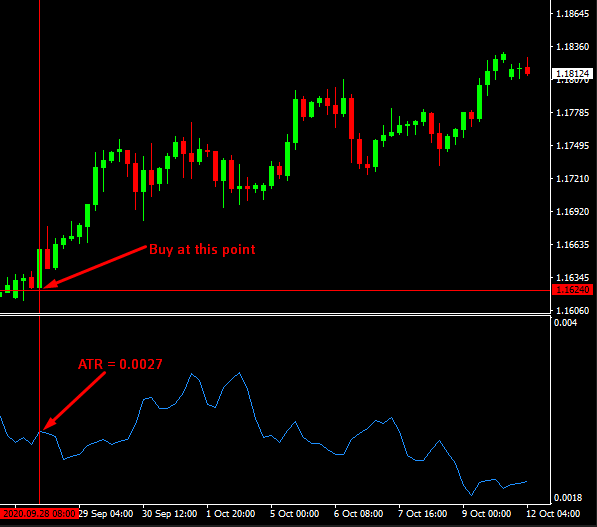
Consider the EUR/USD pair in the chart below. At EUR/USD = 1.16240, the market launches into a strong bull market. The ATR shows a slight bump in the volatility of price action relating to the currency pair. For the next two weeks, the pair keeps a positive trend, although with a declining strength.

If you were to set a stop-loss price at the point that you buy the pair, the ideal stop-loss price level would have been at 1.15700. How did we come to this? Remember the principle we discussed a few paragraphs ago. When you enter the market, the ATR is 0.0027; when you multiply this by 2, it becomes 0.0054. Subtract 0.0054 from 1.16240, and the figure you get is 1.15700.
Using the ATR Indicator on MetaTrader 4
As with all the other MetaTrader 4 (MT4) indicators, using them is just a matter of drag and drop.
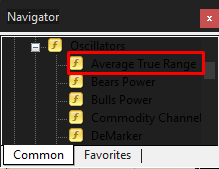
Step 1: Find the indicator from the navigation panel. Because the indicator is a momentum oscillator, you can find it under the Oscillator tag.

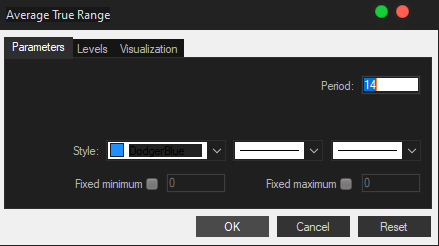
Step 2: Drag and drop the indicator on the price chart. When this window pops up, click ‘OK’ because the parameters are better left at their default reading.

After clicking ‘OK,’ the indicator will appear below the price chart, as shown below:

Always remember that the ATR movement does not indicate the price direction of the currency pair but the level of volatility in the market.
More Tutorial on Technical Indicators:
Granville’s 8 Rules for Moving Average (MA)
Guide to Using Parabolic SAR in Forex Trading
Four Basic Technical Indicators for Forex Beginners
——
About ZFX (Zeal Capital Market)
- The Best Trading Platform Award 2019 from Financial Weekly, Regulated by FSA.
- 100+ trading assets, including Forex, Stocks, Indices, Gold, Crude Oil, etc.
- 3 types of trading accounts to meet the needs of every customer
- 0 commission, low spread, leverage ratio up to 1:2000
- Powerful trading platform that executes 50,000 orders/s
- Open an account with a minimum deposit of $50
- 24-hour Customer Service
——
Risk Warning: The above content is for reference only and does not represent ZFX’s position. ZFX does not assume any form of loss caused by any trading operations conducted in accordance with this article. Please be firm in your thinking and do the corresponding risk control.