Granville’s 8 Rules for Moving Average (MA) | Forex Indicators
One of the most common problems many new forex traders may face is being confused about volatile prices and not knowing the best time in point to buy and sell. In this article, ZFX introduces to you a basic technical indicator – the moving average (MA) – and illustrates how Granville’s 8 rules can be implemented in MA to determine the best timing for trading.
Why is technical analysis important for forex trading?
Those who traded Forex before would agree that technical analysis is quite an important indication to determine the time point of trading. If technical analysis is used correctly, it would help investors to grasp the precise turning point for an upcoming breakout or rebound.
What is technical analysis?
There are mainly two approaches to determine the value of trading assets: fundamental analysis and technical analysis. Fundamental analysis is used to predict the mid-and-long-term price trends based on the well-being of a company and the overall economic environment. Technical analysis means analyzing the chart patterns to anticipate the variations of short-to-long term prices solely based on the historical performance of the price trends.
The moving average (MA): an elementary technical analysis indicator
The moving average (MA) is one of the most common trading indicators that often used in the 24 hours forex trading markets. Its concept is simple – investors can estimate the trends by obtaining the averages of its historical prices. If the current price is higher than its historical average, then the line goes upwards, indicating it is a relatively strong up-going momentum.
For example, a 5-day MA’s value is the estimation on the average of the closing prices in the past 5 trading days. The longer the time period, the longer the trend it follows and vice versa.
In general, MA is totally customizable but usually, 5-day, 10-day, 20-day, and 50-day time periods are more common to be used in the market.
The advantages of MA
MA can be a good reference to forecast the trend direction of a trading asset or to determine its support/resistance levels. Investors can use the sequences of the long and short terms MA and its golden/death crossovers to estimate the trend.
MA is effective in tracking the overall trend especially when there is a strong and obvious movement. Since MA has a relatively simple concept, it is the best suited for the forex trading beginners.
Keep an eye out for the golden/death cross
Simply speaking, when the shorter-term MA crosses above the longer-term MA, it is known as a golden cross. And if it crosses below the longer-term MA, it is known as a death cross. In tradition, the 50-day MA and the 250-day MA are used to find out the golden crosses and death crosses. However, as time changes and the current movement of the financial markets is generally short and hasty, investors are recommended to adjust the base term number as a defined reference.
- For mid-term MA, you can choose 20 days and 50 days as the time periods.
- For short-term MA, 5 days and 20 days time periods are more preferable.

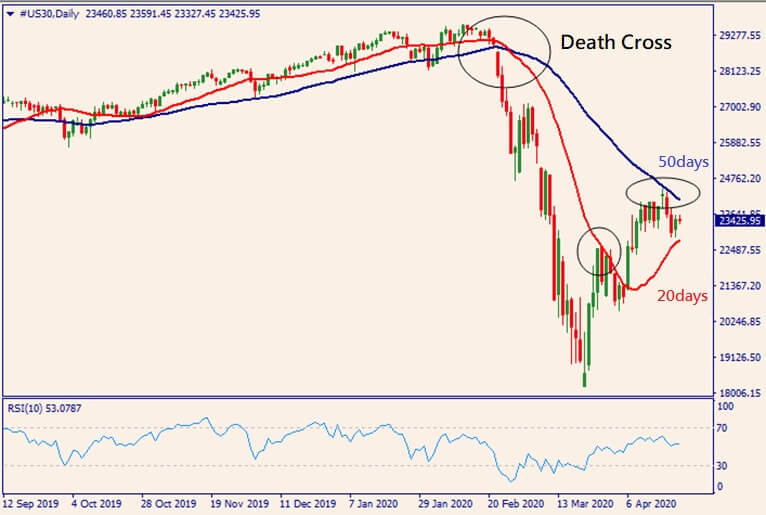
Death cross example
A death cross as above indicates a falling trend of the price. Investors should try short selling as a strategy at this time.
The above example also shows that when the price returns to the point of 50 days MA, a resistance occurs and the price goes down. Such a condition reflects each of the MA plays a role.
Building strategies with Granville’s 8 rules
Joseph E Granville, the U.S. investment expert, observed the trends of both asset prices and MA, and summarised them into 8 situations, which later became Granville’s 8 rules that help investors to establish trading strategies.
What are Granville’s 8 Rules?
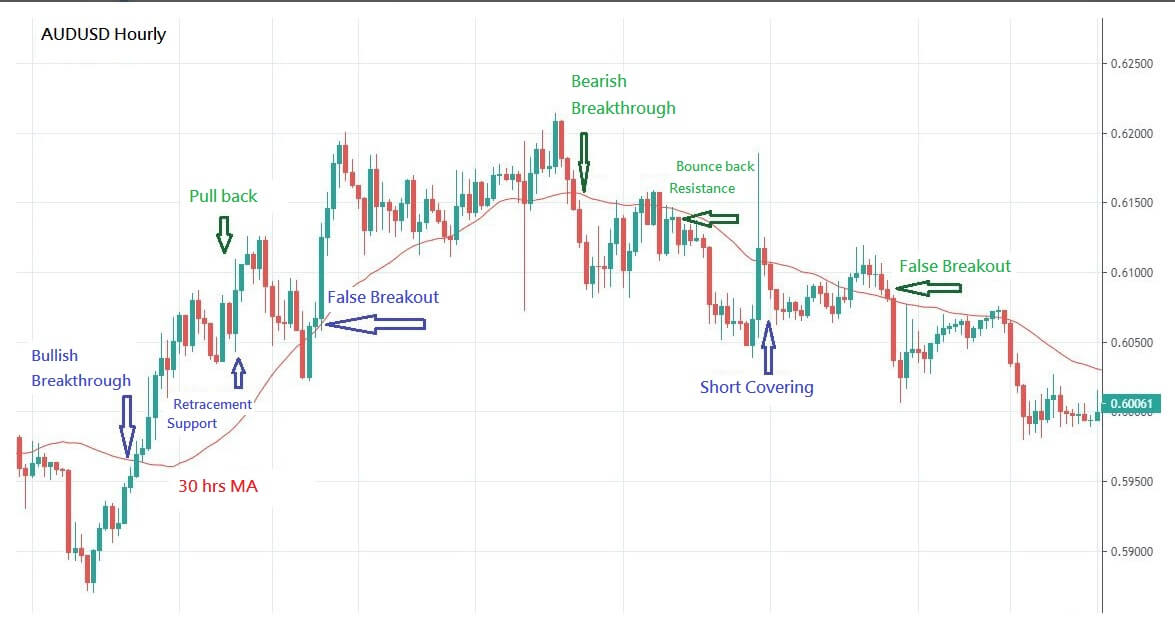
In general, Granville’s 8 Rules are a technical analysis indicator derived from MA, which has included four long and short signals as rule. The principle is to use the resistance and support from MA to find out the best entry position points for trend trading investments.

4 buying signals:
- Breakout Buy – When the price rises from the bottom and breaks the MA of tendency level, it is a buying signal.
- Call-back Buy – When the price goes beyond the MA and the call-back does not fall below the MA can be considered as a buying signal.
- Fake Breakout Buy – The price falls below the MA, however, if the MA is still rising and the short-term price goes back upon the MA, it is a buying signal.
- Off-buy – When the price keeps falling and accumulates certain declines, and it begins to deviate from the moving average, it is a buying signal.
4 selling signals:
- Breakout Sell – When the price falls from above and breaks the MA of tendency level, it is a selling signal.
- Bounce Sell – When the price goes below the MA and it rebounds but does not exceed the MA, it is a selling signal.
- Fake Breakout Sell – The price rises and breaks the MA, however, the MA is still falling and the short-term price falls again below the MA, it is a selling signal.
- Off-sell – When the price keeps rising and accumulates certain increases and starts deviating from the MA, it is a selling signal.
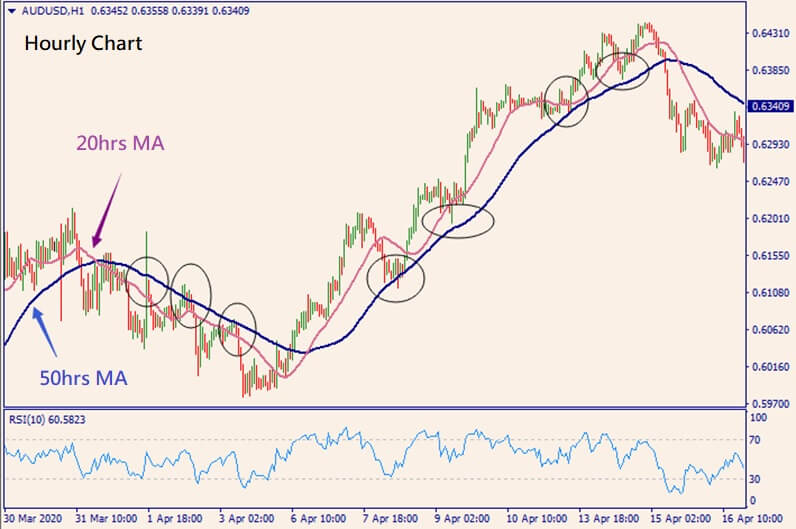
The figure below shows that after an upturn is formed, with the occurrence of the golden cross, it often fails to break the longer-term MA when the price drops. Therefore, investors can predict the upturn and thus be able to know the major trend keep on moving. The circled position in the figure is the key operating point predicted according to Granville’s 8 Rules. Such a trading indicator makes it easier for learners to grasp more opportunities for trading. The reliability of the entire trading strategy can be enhanced if together using the golden cross/death cross.

Granville’s 8 Rules – The Drawbacks
The cross-use of MA and Granville’s 8 Rules described above can be useful only in the cases where an obvious trend appears. However, there are often frequent swings in forex trading. At this time, MA does not provide a good guiding effect if investors do not take any other approaches to estimate the market; it is easy for them to suffer from losses.
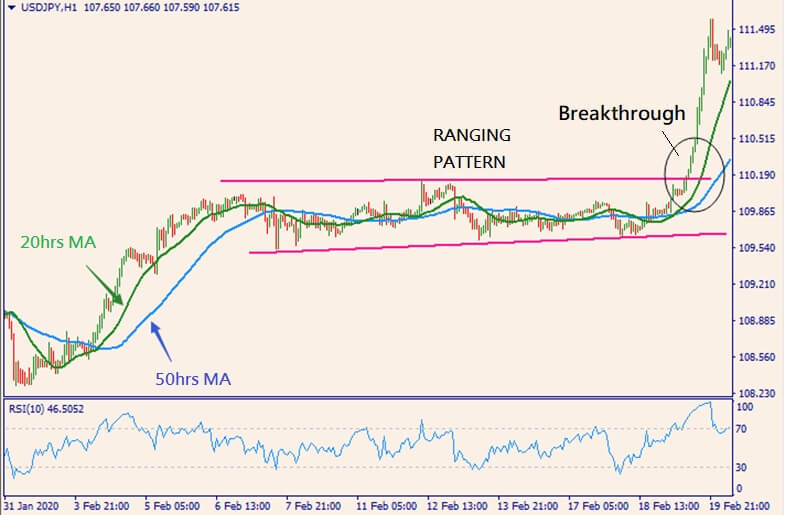
Range of oscillation: Novice should avoid trading

As shown from the USDJPY chart above, a range of oscillations formed before the trend occurs. It is hard to figure out the direction of movement within the range but noted that the MA seems like knotting. This phenomenon is called the tangled MA. It represents a consolidation of the market and the MA does not have much support or resistance effect at the time. New traders should better avoid trading in such conditions, but to establish ranges by trend lines and wait for a breakout.
With the above figures, new traders should already have a preliminary understanding of the moving average. It is a considerably basic concept that is easy to understand and is useful to build a forex trading strategy. However, please note that forex trading requires a series of disciplined long-term strategic arrangements, as technical indicators may sometimes provide wrong signals. Therefore, on-going risk management is also quite important.
Find out more elemental indicators for trading: Four Basic Technical Indicators for Forex Beginners
——
About ZFX (Zeal Capital Market)
- The Best Trading Platform Award 2019 from Financial Weekly, Regulated by FSA.
- 100+ trading assets, including Forex, Stocks, Indices, Gold, Crude Oil, etc.
- 3 types of trading accounts to meet the needs of every customer
- 0 commission, low spread, leverage ratio up to 1:2000
- Powerful trading platform that executes 50,000 orders/s
- Open an account with a minimum deposit of $50
- 24-hour Customer Service
——
Risk Warning: The above content is for reference only and does not represent ZFX’s position. ZFX does not assume any form of loss caused by any trading operations conducted in accordance with this article. Please be firm in your thinking and do the corresponding risk control.