Four Basic Technical Indicators for Forex Beginners
Whether you’re a forex investor with a bit of trading experience or someone new to the forex market, if you haven’t studied finance yourself, you’ll be unfamiliar with the ever-changing charts at first and don’t know where to start.
At first glance, the fluctuation of the market seems to be out of order, but in the almost random fluctuation, there are some special rules. Therefore, the “technical analysis” we often hear is actually trying to find the “regularity” in such “randomness”. By recording, tracking, sorting, and summarizing over time, it is not difficult to find that the forex market has a particularly strong correlation with technical indicators, and individual trends are particularly sensitive in the prediction of some indicators.
Because the technical indicators work well, they gradually become popular and eventually be used by traders on a daily basis. This article will briefly introduce you to the four most common technical indicators for the forex market.
1 / Moving Average (MA)
For starters, Moving Averages (MA) is recommended. The fact that MA is both easy to understand and powerful in tracking trends makes it the most widely used indicator in the forex market.
Definition and application of moving average
We often see such terms as ‘monthly moving average’, ‘weekly moving average’ and ‘annual moving average’ in analytical articles. In fact, they all refer to MA. Taking the 5-day moving average as an example: the closing price of the past five trading days is added together and averaged to obtain the value of the 5-day moving average. If the market price is higher than the 5-day moving average, it means that there is a strong upward force in the short term, and it may evolve into an upward trend. At this point, we can follow the trend and go long.
As shown in the figure above, the trend continues to be above the moving average and the price is moving up. In this case, we can determine the direction of the main trend immediately by the position of the price around the moving average and decide whether to go long or short. The ease with which moving averages can be used is also what makes them so popular with newcomers to the forex market.
Long – and short-term averages are also often used in conjunction with each other to help traders identify the best opportunity to buy or sell forex. For details, please see: Granville’s 8 Rules for Moving Average (MA)
Advantages of the MA
The more clear the market trend is, the more efficient and profitable buying and selling decisions can be made using the moving average.
Disadvantage of MA
If the market trend is not obvious, the moving average may lose reference value, then, it is easy to make a mistake to trade with the moving average.
2 / Relative Strength Index (RSI)
We just mentioned that there is a trend in the market, but the trend can’t always go up or down. One day, the uptrend will end and go down, and the market may gradually come out of the trough and go up. So how do we know when a trend will turn? In this case, RSI, i.e. Relative Strength Index, can provide a good reference.

Definition and application of RSI
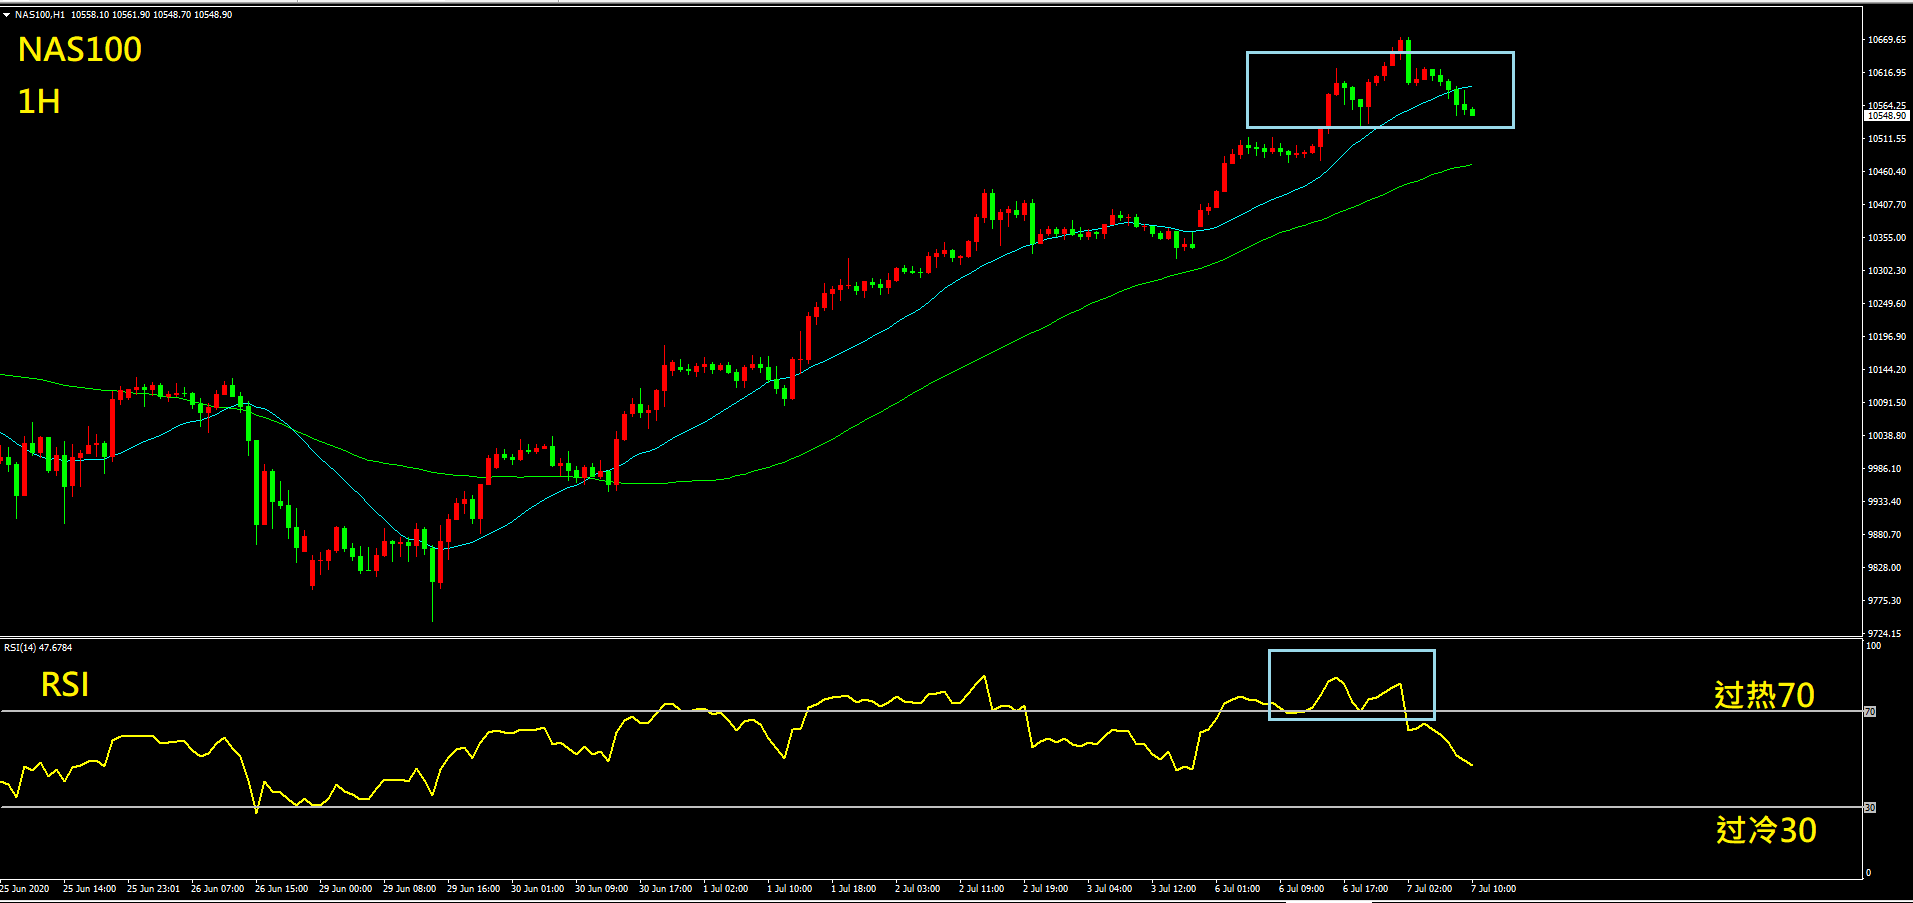
In general, RSI is most commonly used on a 14-day timeframe, which is calculated based on the change of the closing price in the last 14 days. The RSI also has two reference values: 30 and 70 (as shown in the figure above). When RSI surpasses 70, it means that the recent rally is too strong and has reached the level of overbought. On the contrary, if RSI drops below 30, it means the sharp decline in the recent market has resulted in an oversold condition and the market may bounce back soon.

As shown in the figure above, the RSI is in the overbought zone (above 70), so we can predict that the upward trend may reverse itself in the foreseeable future. At this time, we can stop our previous long positions, but it is not recommended to follow the heard.
Advantages of RSI
In general, the signal is more accurate when the RSI is lower than 30 or higher than 70. So if you use the RSI properly, you can avoid the risk of a market reversal if you get too aggressive in forex trading. If the RSI is between 30 and 70, it is of little significance and can be ignored.
Disadvantage of RSI
When the entire market is strongly heading in a certain direction (one-sided markets), RSI may stay below 30 or above 70 for a long time, and then RSI will lose its reference value.
3 / STOCHASTICS (KD index)
The stochastic oscillator is also known as KD index. The most common timeframe for KD index is 9 days, which is a relatively sensitive and fast index in the attached diagram. Compared with the 14 days RSI, it moves slightly faster, but the usage of both indicators s is roughly the same.

Definition and application of Stochastic oscillator
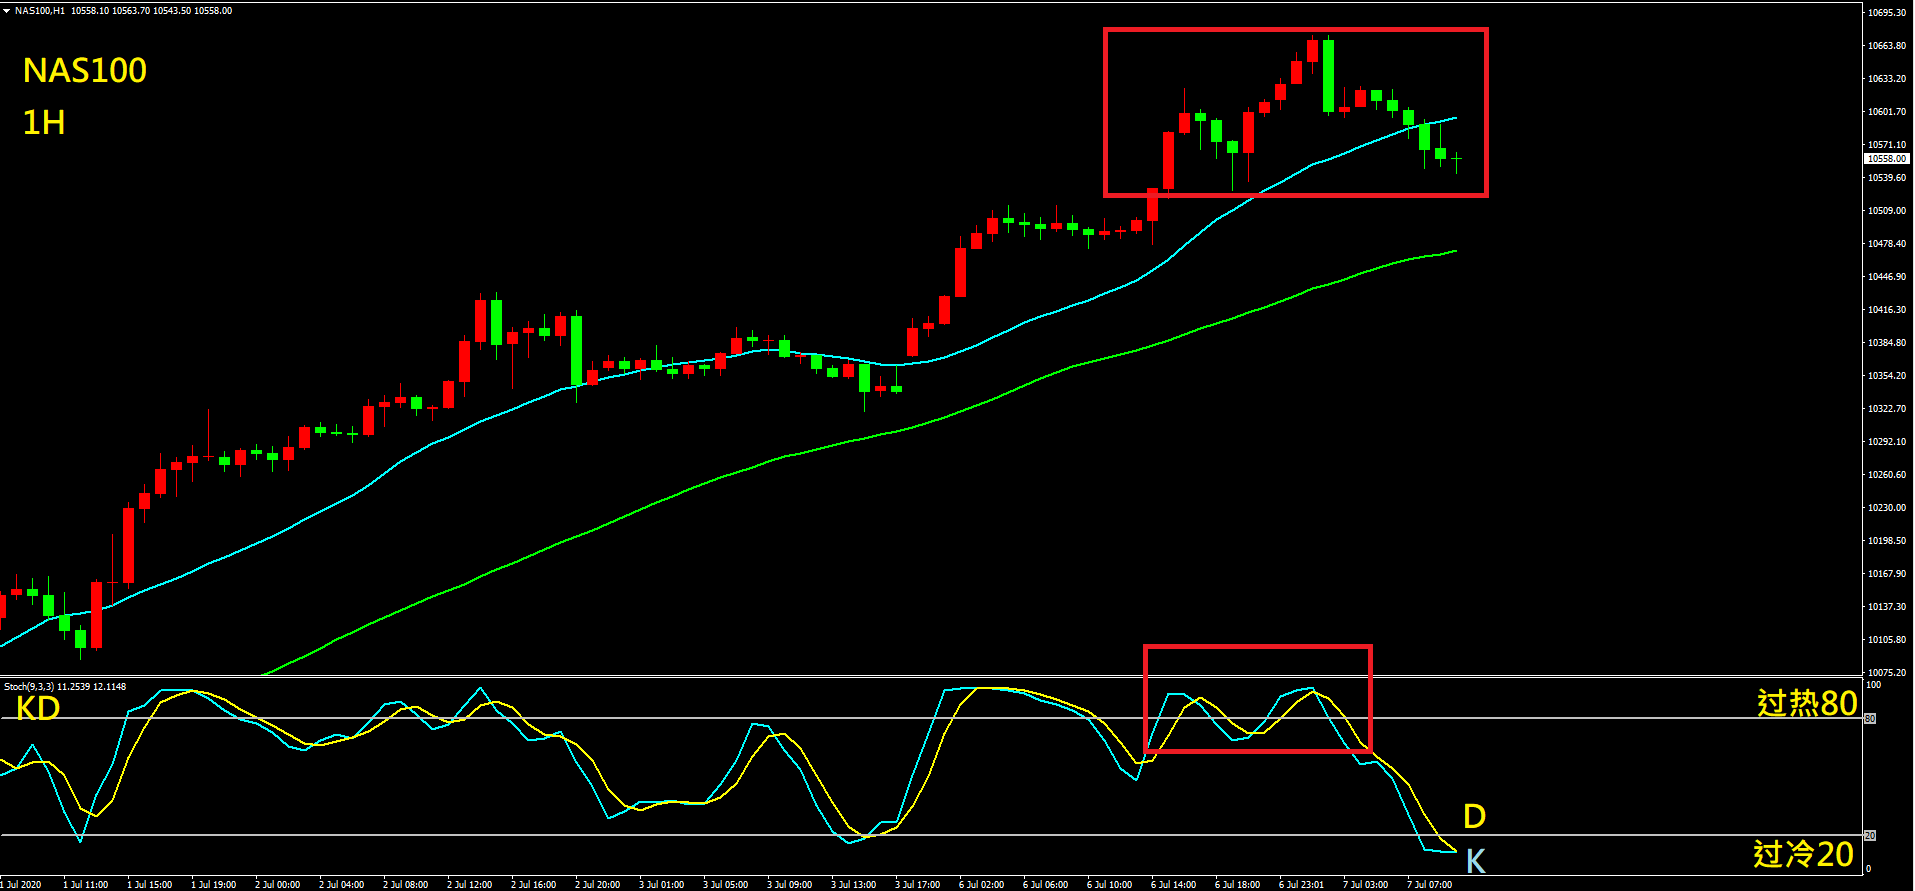
The difference between KD and RSI lies in the fact that the KD index is composed of two lines, a faster K line (%K) and a slower D line (%D). The position and mode of the intersection of %K and %D can be used to predict the subsequent price changes. When %K crosses above %D, it is regarded as “golden cross”, which is a sign that the price is about to go up. If %K crosses below %D the D line, it is called a “death cross”, which indicates a bearish price movement.
Same as RSI, KD also has two reference lines: oversold (20) and overbought (80). Therefore, If a goldren cross occurs when %K%D crosses below 20, it means that the downward trend is about to end and the market is going to rebound; If a death cross occurs when %K% are above 80, it means the rally has temporarily run out of momentum and the market is ready to go down.

As shown in the figure above, as the trend goes higher, the KD index also comes to the overbought zone. Therefore, it can be reasonably inferred that there will be a downward correction at some point in the future. In this way, the risk of being tied up by the market can be effectively avoided.
Advantages of STOCHASTICS
Generally speaking, KD is more of a reference value for a golden cross below 20 and death cross above 80, while the crossover between 20 and 80 does not have to be taken into account. Most of the risks of market reversals can be avoided if KD is used properly.
Meanwhile, KD, because of its short period, is more sensitive to the RSI. If we compare the actual graphs of the two indicators, we can find that KD sends out the downward correction signal faster than RSI. Therefore, KD is also more suitable for more aggressive investors who want to get a head start.
Disadvantage of STOCHASTICS
KD’s sensitivity, though makes it faster at sending out buying signals, also leads to the problem of spurious signals, and the frequency of errors is relatively high. In terms of application, more emphasis is placed on the experience and accuracy of consumer analysis, so novice forex traders may be more vulnerable to losses in the initial application.
Similarly, KD tends to stay above 80 or below 20 in the case of an extremely strong or weak market. Therefore, KD’s reference is relatively limited under a one-sided market.
4 / Moving Average Convergence/Divergence (MACD)
MACD is a trading indicator that has long been used in technical analysis. Since the calculation of the indictor is very complicated, here, we will first briefly introduce its parameters and practical application. The most commonly used parameters for MACD is 12,26,9. Compared with RSI and KD index, MACD usually sends out the signal of buying and selling slower due to its larger parameter. However, there are relatively few false signals, which make it suitable for medium and long-term trading.

Definition and application of MACD
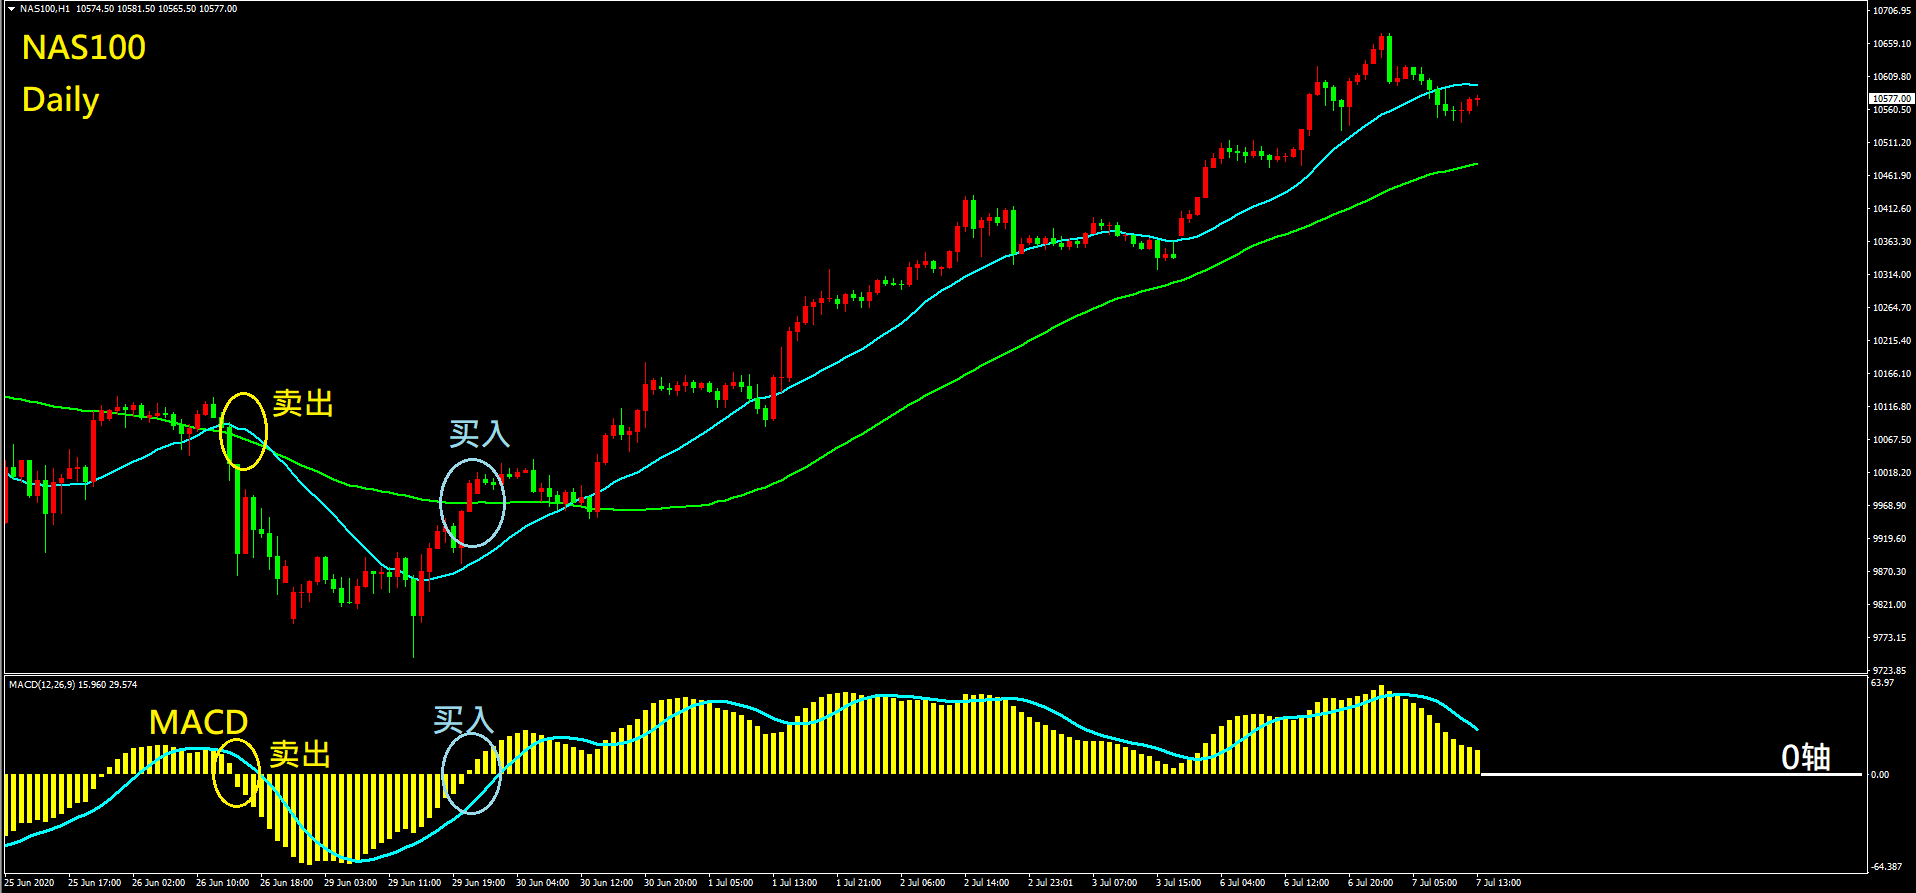
MACD is composed of the bars (yellow), the zero line and the DIF line (blue). When the bar changes from negative to positive (from below the zero line to above the zero axis), the DIF line will cross above zero axis, which represents an upward trend and is regarded as a buying signal. Conversely, when the bar is turning from positive to negative (above zero to below zero), the DIF line will crosses below the zero line, indicating a sell signal.

As shown above, the DIF line and the bar cross above the zero line, which is a buying signal. If you go long now, you are likely to buy at a relatively low point and earn big returns from the upward trend. Read detailed MACD tutorial
Advantages of the MACD
Identifying the trend by the relationship between the bar and the zero line is more intuitive in the application. In addition, since the probability of false signals is low, it is generally welcomed by novices.
Disadvantage of MACD
When the market fluctuates rapidly, due to the lag of MACD, it is easy to miss the opportunity to enter the market if it is used in short-term trading. In addition, the MACD is not ideal for the shock/dollar line. To some extent, MACD will also test the ability of traders to discern trends and patterns, so it is less suitable for traders who want to get a head start.
——
Risk Warning: The above content is for reference only and does not represent ZFX’s position. ZFX does not assume any form of loss caused by any trading operations conducted in accordance with this article. Please be firm in your thinking and do the corresponding risk control.
ZFX (Zeal Capital Market) is an online forex & CFD broker providing more than 100 products for forex trading, commodity trading, index trading, and share CFDs trading. The minimum deposit for the account opening is only USD 50. Open a trading account and download our MT4 trading platform now!